It’s still getting hotter. And, much to the tune of last week’s blog, the one before that and most possibly the one after this, the fauna and flora of Planet Earth are still having a hard time coping with it.
Today we turn our attention to arguably one of the greatest
impacts of global climate change; range shifts. In essence, as the Earth gets
hotter, organisms find themselves being forced out of their optimum conditions,
and move to colder environments to escape the heat. Now, when I say “range
shifts”, I don’t wish to imply that organisms are high-tailing it to their poles of choice (North for the Northern Hemisphere and
so on). In fact Parmesan et al. (1999) warn explicitly against this mistake, and gently
remind us that a range shifts occur at the population, not the individual,
level. A range shift hence results from changes in the ratios of
extinctions to colonisations at the northern and southern boundaries (or top
and bottom of the elevation range) of a species; put simply, a northern (or
uphill) range shift will occur when net colonisation at the upper boundary
exceeds net extinctions of new colonies, and vice versa.
These shifts in the distribution of species are now occurring on a global scale, and few organisms are left out. In a meta-analysis of 1,367 species responses spanning three continents, for example, Chen
et al. (2011) found that due to our
gradually warming climate, species on average are moving their ranges
northwards by 16.9km and increasing elevation by 11m each decade. This
is substantial. Seeing as Walther et
al. 2001 put us at around a rise of 0.6C over the last 100 years and we are already seeing migrations of such magnitude, it is possible that if such warming trends continue we may soon see changes to species distribution of biblical proportions.
 |
| Range shifts may soon reach biblical proportions |
Chen et al.’s meta-analysis
is pretty damning, and looks only at two types of environ, temperate zones and tropical
mountains. So naturally, as a geographer who knows that one study is never enough to reach a concrete conclusion, I decided to investigate further. It didn't take me long however to stumble across veritable mountains of evidence.
There exists innumerable studies of a humungous variety of taxons that cluster together to create a huge culture of scienfitic support for climate change induced range-shift. In my own ritual foray
into bloggable literature, I was overwhelmed with examples, and chose a few to share with you. For the sake of simplicity, ALL of the following studies listed climate change as the number one cause of range shifts, often backing up these claims with statistics such as regressions etc.
The
first, in tribute to last week’s blog about the phenology of migrant
birds (which you should read), is a study analysing the
changing distribution of avian species. Thomas and Lennon (1999) pored through data
from two atlases of breeding birds compiled for Britain, and found that the
northern margins of many species have increased by an average of 18.9km in as
few as 20 years. This is below the
average set by Chen et al., which is
surprising as, opposed to many of their fellow fauna (the slug, for example),
birds are relatively mobile animals, however this is still a staggering distance for
two decades.
Also of interest is Lenoir et al.’s (2008) meta-analysis, in which the altitudinal distribution of
171 forest plant species are analysed between 1905 and 2005, along what is
almost the entirety of Europe’s elevation range (0-2600masl). The study focuses
on forest communities, as such communities arguably represent regional trends
better than open areas which undergo greater influence from climatic variation
and agriculture (due to what Lenoir et al.
refer to as the “buffer zone” of the forest canopy that regulates
temperatures).
Lenoir et al.,
unlike Thomas and Lennon, study what they refer to as the “altitudinal position of
species’ maximum probability of presence”; essentially the centre of a
species’ distribution, where conditions are most favourable. They find that for
2/3rds of the species, these “centre points”, if you will, shift uphill at an
average rate of 29.4m per decade, following temperature gradients (which Lenoir et al. have noted have increased by 0.6C generally, and up to 1C for alpine environs over the past 100 years).
 |
| Not an accurate representation of range shifts, but funny nonetheless. |
Important also is the plight of invertebrates, and butterflies, being particular sensitive to temperate, offer a fine example of how climate is affecting distributions. Now, the aforementioned Parmesan et al. (1999), in a study of 35 non-migratory English butterflies, observe range
changes of between 35 – 240km for 63% of species over the last 30-100 years. This, they suggest, is in response to tempeature change (to which. as mentioned, butterflies are especially sensitive). A nice
example can be found below, where Parmesan et al. (1999) mapped the changing distribution of
one Pararge aegeria.
 |
| Here is a map by Parmesan et al. (1999) showing the distribution change of the good old Pararge aegeria over a period of about 100 years. It's hard to see, so I will translate for you. The black dots represent distribution between 1915 - 1939, the red 1940 - 1969 and the blue from 1970 -1979. There is a clear northwards trend. |
Overwhelmingly then it becomes clear that range changes are
not isolated incidents – they are happening for all forms of taxa all over the
world. If anything, to see an organism with a stable distribution is becoming
the exception and not the rule. The evidence is there and it is dramatically
in favour of climate change causing mass population migration.
I want to talk more about range shifts because, as per
usual, there is a catch. You see, not all range changes are equal.
Whilst some animals spread like wildfire, others are left in the dust. Range shifts are
far from an equitable process, favouring species with high dispersal
capabilities, faster life cycles, and generalist requirements. There is great
variation then in distributional shifts, made rather obvious by some the range
of movements seen in the aforementioned studies. This is illustrated pretty
well by Chen et al.’s graphs below.
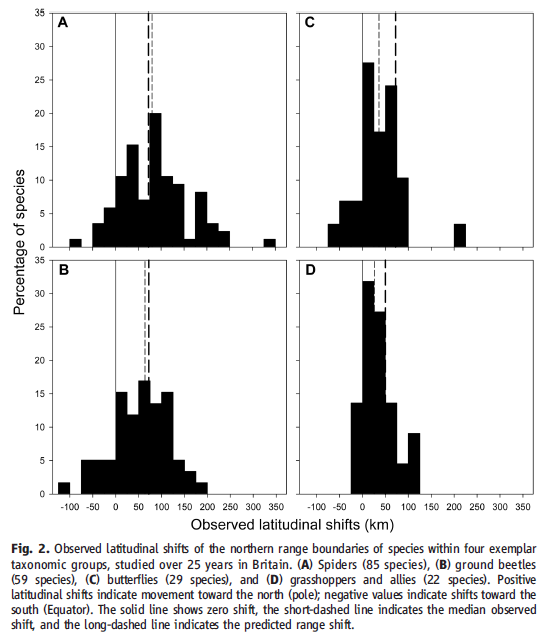 |
| These graphs by Chen et al. show observed latitudinal shifts for four exemplar taxa over 25 years. These are A - spiders, B - ground beetles, C - butterflies and D - grasshoppers and allies. You can see that many species lie above and below the mean, meaning that some are streaming ahead whilst others are left firmly behind |
This is a really interesting topic that I absolutely want to go
into a lot of detail about. However, having examined the evidence for range
shifts today, I find myself already clocking 1000+ words. I think then that it is only sensible to wait a little while before we dive into
the causes and (rather disastrous) effects of lags in range shift.
In other news, my friend sent me this really interesting article the other day, that talks about what the world would look like in terms of large mammal biodiversity if humans had never existed. It's a really interesting read - find it here - that I may come back and talk about in a future blog.
In other news, my friend sent me this really interesting article the other day, that talks about what the world would look like in terms of large mammal biodiversity if humans had never existed. It's a really interesting read - find it here - that I may come back and talk about in a future blog.